Archetype Tutorial II
Step 1. Creating the Archetype
Introduction
This tutorial guide is a supplement to the Archetypes guide, utilizing existing models to provide a step-by-step demonstration on how to design basic archetypes for different types of clinical decision support (CDS) applications using the Archetype Designer.
Before starting the modelling process, it is of vital importance to understand that the model of a clinical concept must be constructed based upon a solid scientific basis. It is therefore essential to thoroughly review the available scientific literature prior to commencing the construction of the archetype to minimise the potential risk of errors. Once the model has been published, users should be able to quickly access the scientific material upon which the model is based; always make sure to list the references.
Resources containing more in-depth information about the archetype definition language (ADL) are listed at the end of the document for quick access in case they are needed. There is also a link to our CDS Apps Overview page on GitHub available in this section, containing over 600 demo applications (using 600+ archetypes and guidelines).
Tutorial II – Protocols
Protocols
Archetypes used in protocol applications generally make use of the ordinal data element.
Examples of clinical applications using protocols are: AUDIT-C, Bishop Score, CHA2DS2-VASc, Downton Fall Risk Index (DFRI), Generalized Anxiety Disorder Score (GAD-7), Glasgow Coma Scale (GCS), International Prostate Symptom Score (IPSS), Modified Early Warning Score (MEWS), National Early Warning Score (NEWS) and Wells Criteria for DVT. This tutorial will focus on the clinical concept Apgar Score. All of the applications are available in our gdl-guideline-models GitHub repository and can be tested via the CDS Apps Overview page in the Links and Resources section.
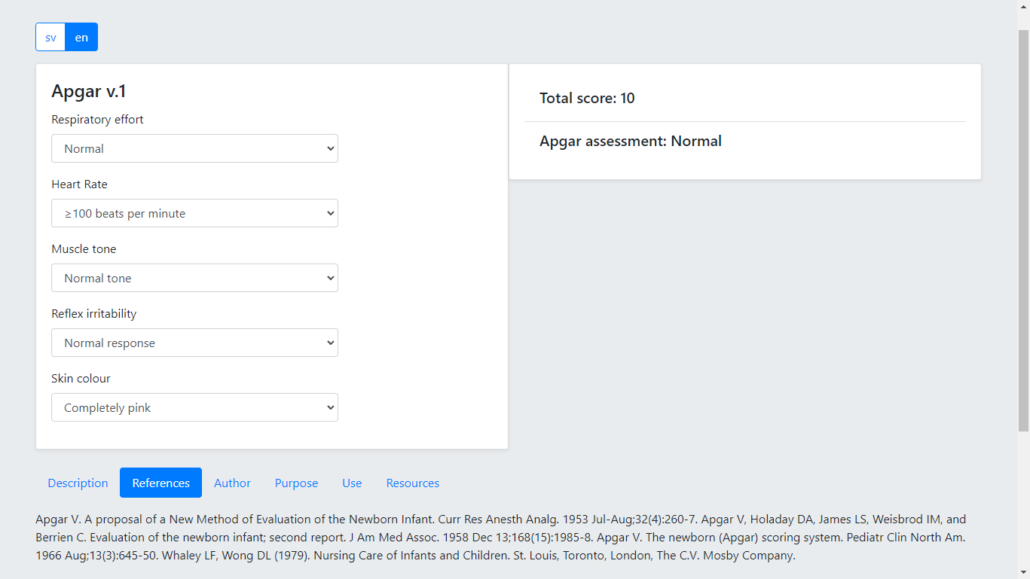
Apgar Score
The Apgar score is a long established clinical tool that helps clinicians assess the health of new-born infants. The tool’s name is a mnemonic taken from the first letters of the words that represent the five aspects measured when assessing the patient; Appearance, Pulse, Grimace, Activity and Respiration. The Apgar Score generates an accumulated total score as well as an overall assessment based on the result of the clinical examination. An image of the finished application is displayed below.
Step 1. Creating the Archetype
After logging in to the Archetype Designer and selecting a repository, click on the New button, select the appropriate RM type and fill in the Concept field in the dialog box as shown below.
Create the archetype:
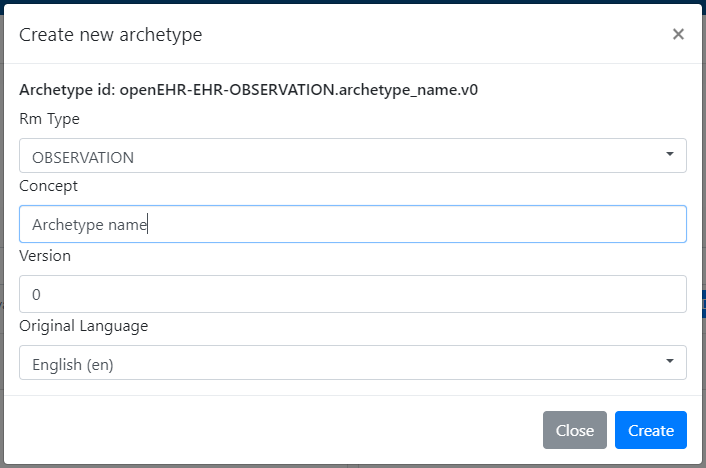
- Choose OBSERVATION from the RM type drop-down menu (or directly from the New button).
- Name the archetype in the Concept text box.
- Click Create to create the archetype.
Recall from the archetype introduction guide that observation archetypes are used to document and store data components and values related to a given clinical concept that can be observed or gathered at a specific point in time.
Step 2. Adding Data Elements
To add data elements to the archetype, select the Tree tab. For this model, ordinal elements will be used. Simply follow the instructions illustrated below.
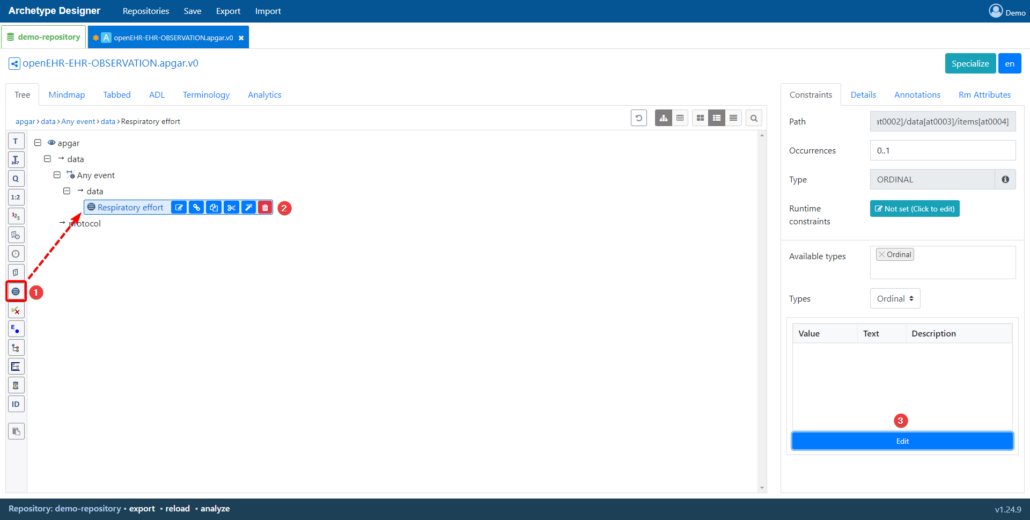
Add ordinal elements:
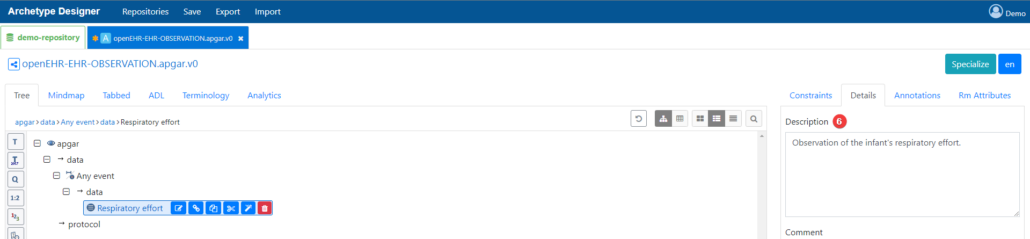
- Click on the ordinal element in the toolbar.
- Name the element: “Respiratory effort”.
- Click on the Edit button to add the values.
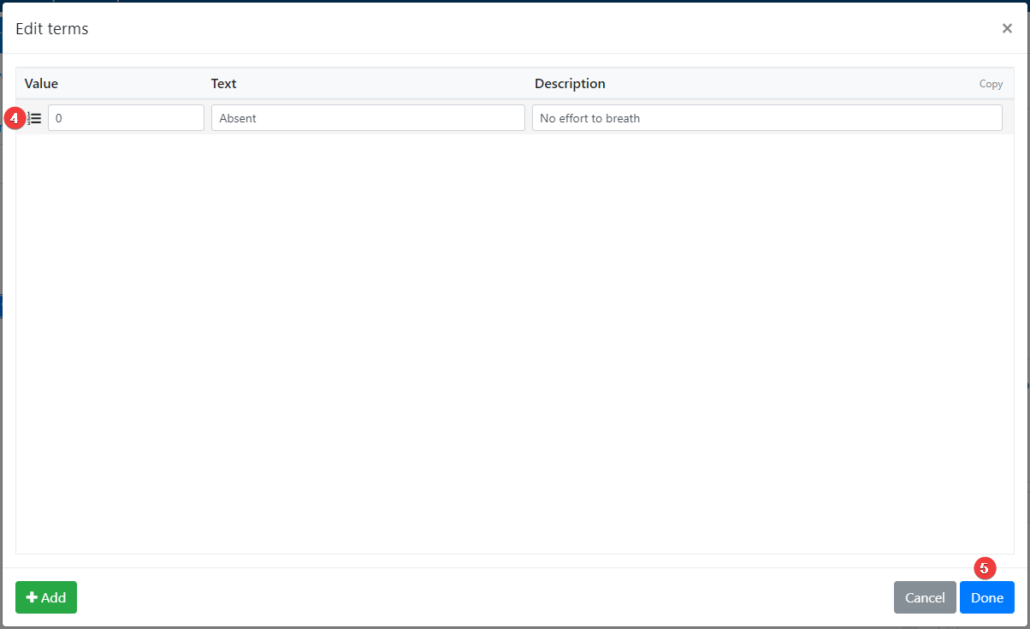
- Create the number of alternatives required, in this case “0 – Absent, 1 – Weak or irregular and 2 – Normal”. A description of the element can be inserted.
- Click on Done for the values to be added.
- Enter a description of the element – in this case, “Observation of the infant’s respiratory effort“.
Repeat for the rest of the required ordinal elements, in accordance with Table 1 presented below:
Table 1. Apgar Score. Alternatives in Roman type, corresponding descriptions in italics.
| Apgar Score | 0p | 1p | 2p | |
| A | Activity, muscle tone | Limp or flaccid – no spontaneous movement. | Reduced tone – some flexion of extremities. | Normal tone – normal, vigorous movements. |
| P | Pulse, heart rate | Absent – no heart beat is seen, felt or heard. | <100 beats per minute – heart rate less than 100 beats per minute. | ≥100 beats per minute – heart rate greater than or equal to 100 beats per minute. |
| G | Grimace, reflex irritability | No response – no response to stimulation. | Reduced response – grimace or feeble cry when stimulated. | Normal response – grimace, sneeze, cough or pulls away when stimulated. |
| A | Appearance, skin colour | Completely blue – body and extremities are blue. | Body pink; extremities blue – body is pink; extremities are blue. | Completely pink – body and extremities are pink; no cyanosis. |
| R | Respiration, respiratory effort | Absent – no effort to breathe. | Weak or irregular – some effort to breath, moving chest | Normal – breathing normally or crying |
After all of the ordinal elements have been created, it is time to create a count element. This element stores the resulting total score after all of the individual scores have been added together.
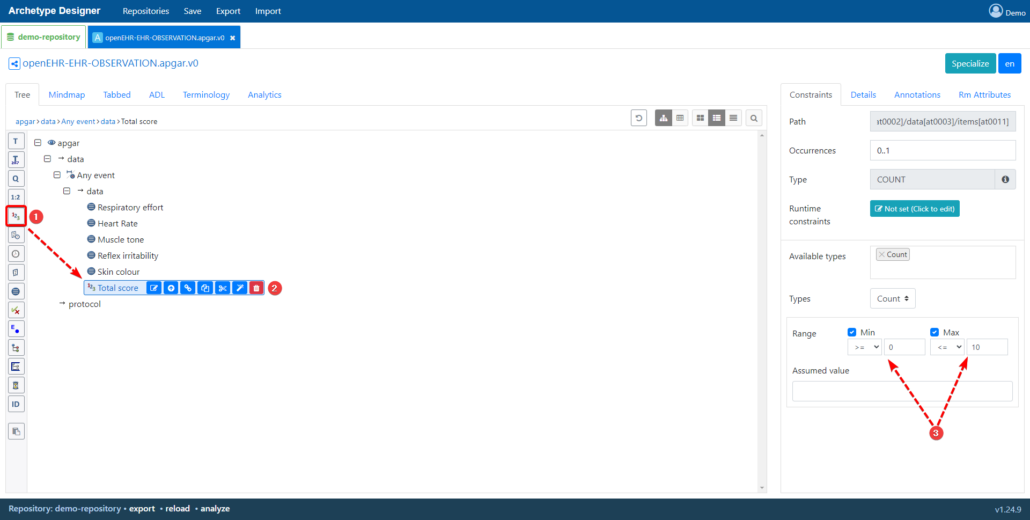
- Click on the 123 (count element) in the toolbar.
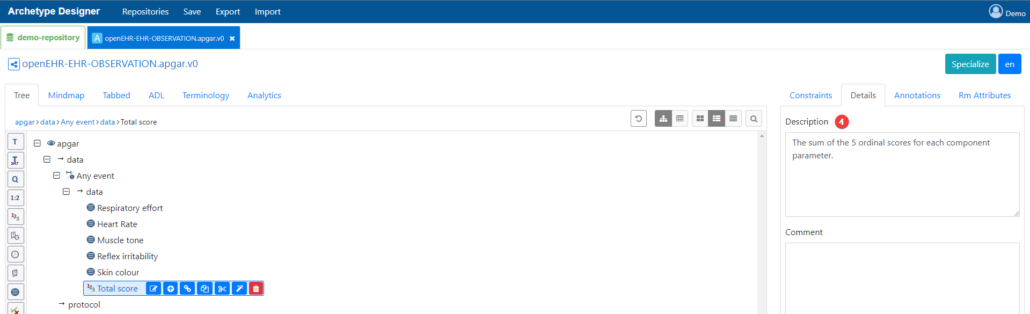
- Name the element: “Total score“.
- Insert the possible score range: here 0 to 10 as each of the five Apgar variables score a maximum of two points. Set the min/max range values for the score by unselecting the Unbound checkbox next to Range.
- Enter a description of the element.
Once all the data elements have been added, a structured overview of the content is displayed under the Terminology tab along with the assigned at-codes:
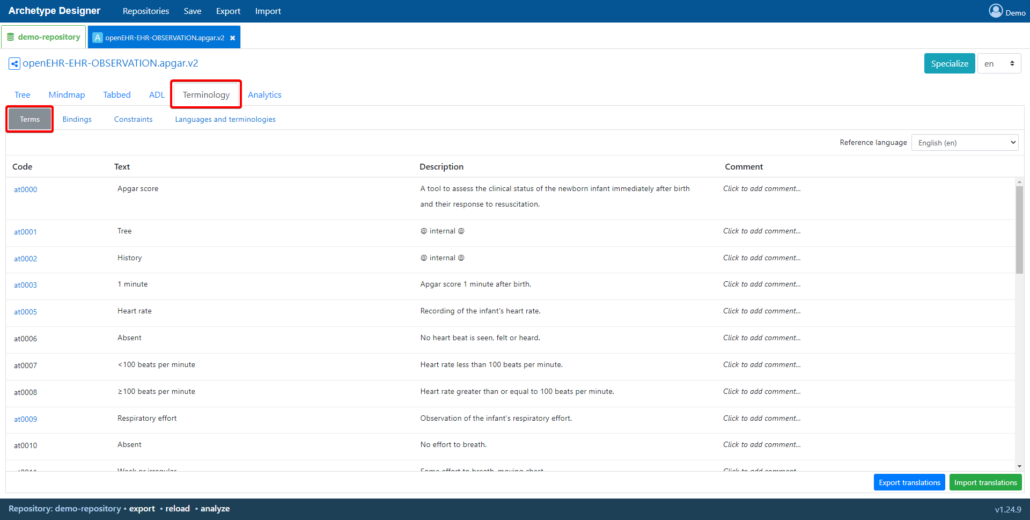
It is highly recommended to use this tab when translating the data elements of the archetype at a later stage.
Step 3. Adding Metadata
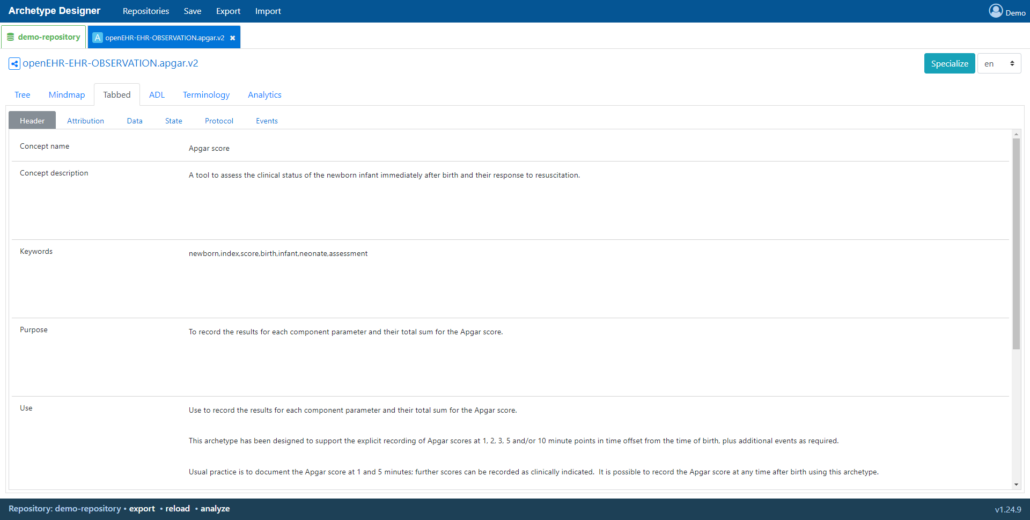
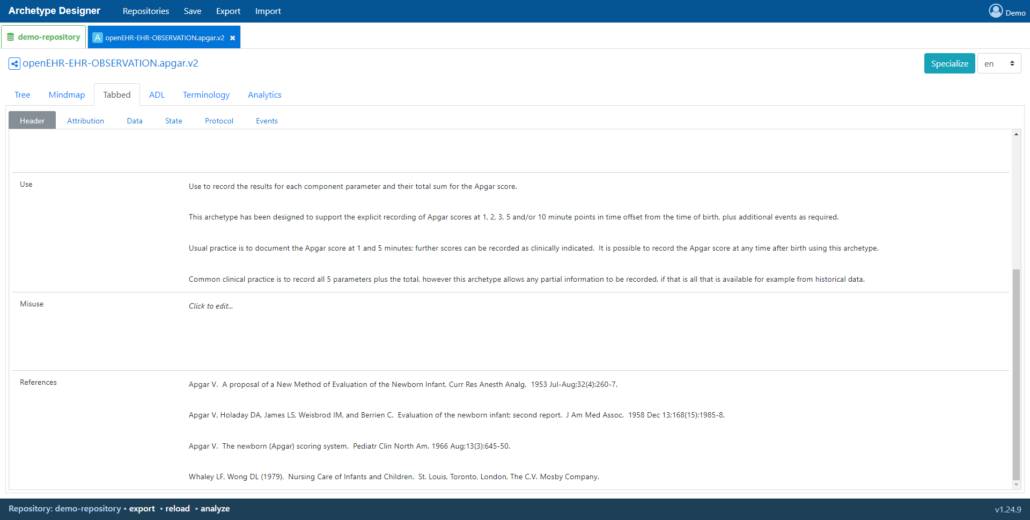
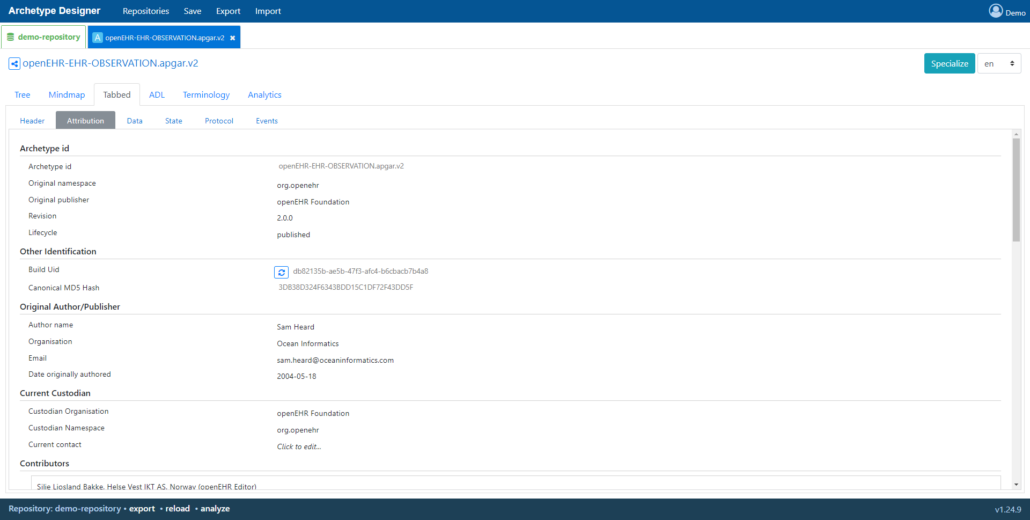
Now, all that remains is to enter the metadata. An overview of the finished model is provided below as an example.